One page – two jobs
The Plan Page both helps people work with the route and sells access to the full trip.
A person gets one open day. To see the rest, they have to unlock the trip. On this page they need to understand the quality of the plan, what can be edited and the terms of the purchase.
I started with a question: what exactly gets in the way of understanding the plan and its value before payment?
How I researched the product
I did three passes through production: seven-day trips to Milan and Fano and a three-day trip to Paris – on desktop and mobile. Separately I checked payment, generation of the locked days, adding a hotel and the budget update.
In parallel I analysed purchases, tour completion, AI interactions and returning users. I checked conclusions with the developer: some problems depended on the generation logic, some on how the interface explained it.
I also checked observations from the old mockups in production. For example, the problem with data from another city couldn’t be reproduced – I removed it from the final list.
How the metrics shaped the decisions
People decide to buy within minutes
- Data
- 13 buyers in 90 days. Median time to purchase – 250 seconds. In a separate retention sample of 325 users, 6.6% came back in the first week.
- What I checked
- The page had five names for one purchase. Weather, the map and editing were listed among paid features, although the tour called them free. Unlimited AI after payment wasn’t explained.
- Decision
- First priority: a clear offer – one name for the purchase, a clear line between free and paid, and an explanation of what opens after payment.
NoteThe numbers don’t prove why people don’t buy, but together with the audit they became the argument to focus on the first encounter with the plan.
A low AI usage figure needed checking
- Data
- AI Replace had only 3 recorded interactions among 353 non-buyers – about 1%.
- What I checked
- After the text button was replaced with an icon, the action stopped showing up correctly in the existing tracking. The figure didn’t allow judging real usage of the feature.
- Decision
- I didn’t use the low figure as an argument to remove AI Replace. I suggested making the action clearer and restoring its measurement.
NoteFor further evaluation it’s important to see the whole scenario: run AI → get a result → accept or undo the change.
28% finished the tour, but the problem was also its content
- Data
- Of 318 tour starts, 88 finished – about 28%. The median duration was 37 seconds for nine steps.
- What I checked
- Four steps described features that didn’t exist or weren’t available in the current state. The tour set expectations the page didn’t confirm.
- What I suggested
- Align the tips with the product’s real features and states, and explain actions at the moment of interaction. I put the tour recommendations outside the agreed Plan Page redesign.
NoteWith so few buyers I didn’t draw conclusions about the tour’s effect on conversion.
Checking data quality first
On 20 July several parts of the product changed at once: registration, the cookie banner and the edit button. The 90-day statistics combined different versions of the user journey.
I asked for separate cuts before and after the changes. I also found that the existing events didn’t cover working with the table – the page’s main tool. I prepared a list of 7 priority and 4 additional events.
Explain the budget before unlocking
- Problem
- In a test seven-day trip to Milan, €386 showed before payment and €2 456 after. I recalculated the costs: the initial sum covered only the first day for two people – about 16% of the full estimate. In the interface it looked like the budget for the whole trip. The developer confirmed: days 2–7 are generated only after payment.
- What I suggested
- Label the initial sum as the budget of the open day. After payment, show the generation state, and the total budget once the calculation is done.
- What it should change
- People will understand which costs are already counted and why the sum updates. The gap between the partial and full estimate becomes an explained part of the scenario.
Keep the table and improve navigation
- Problem
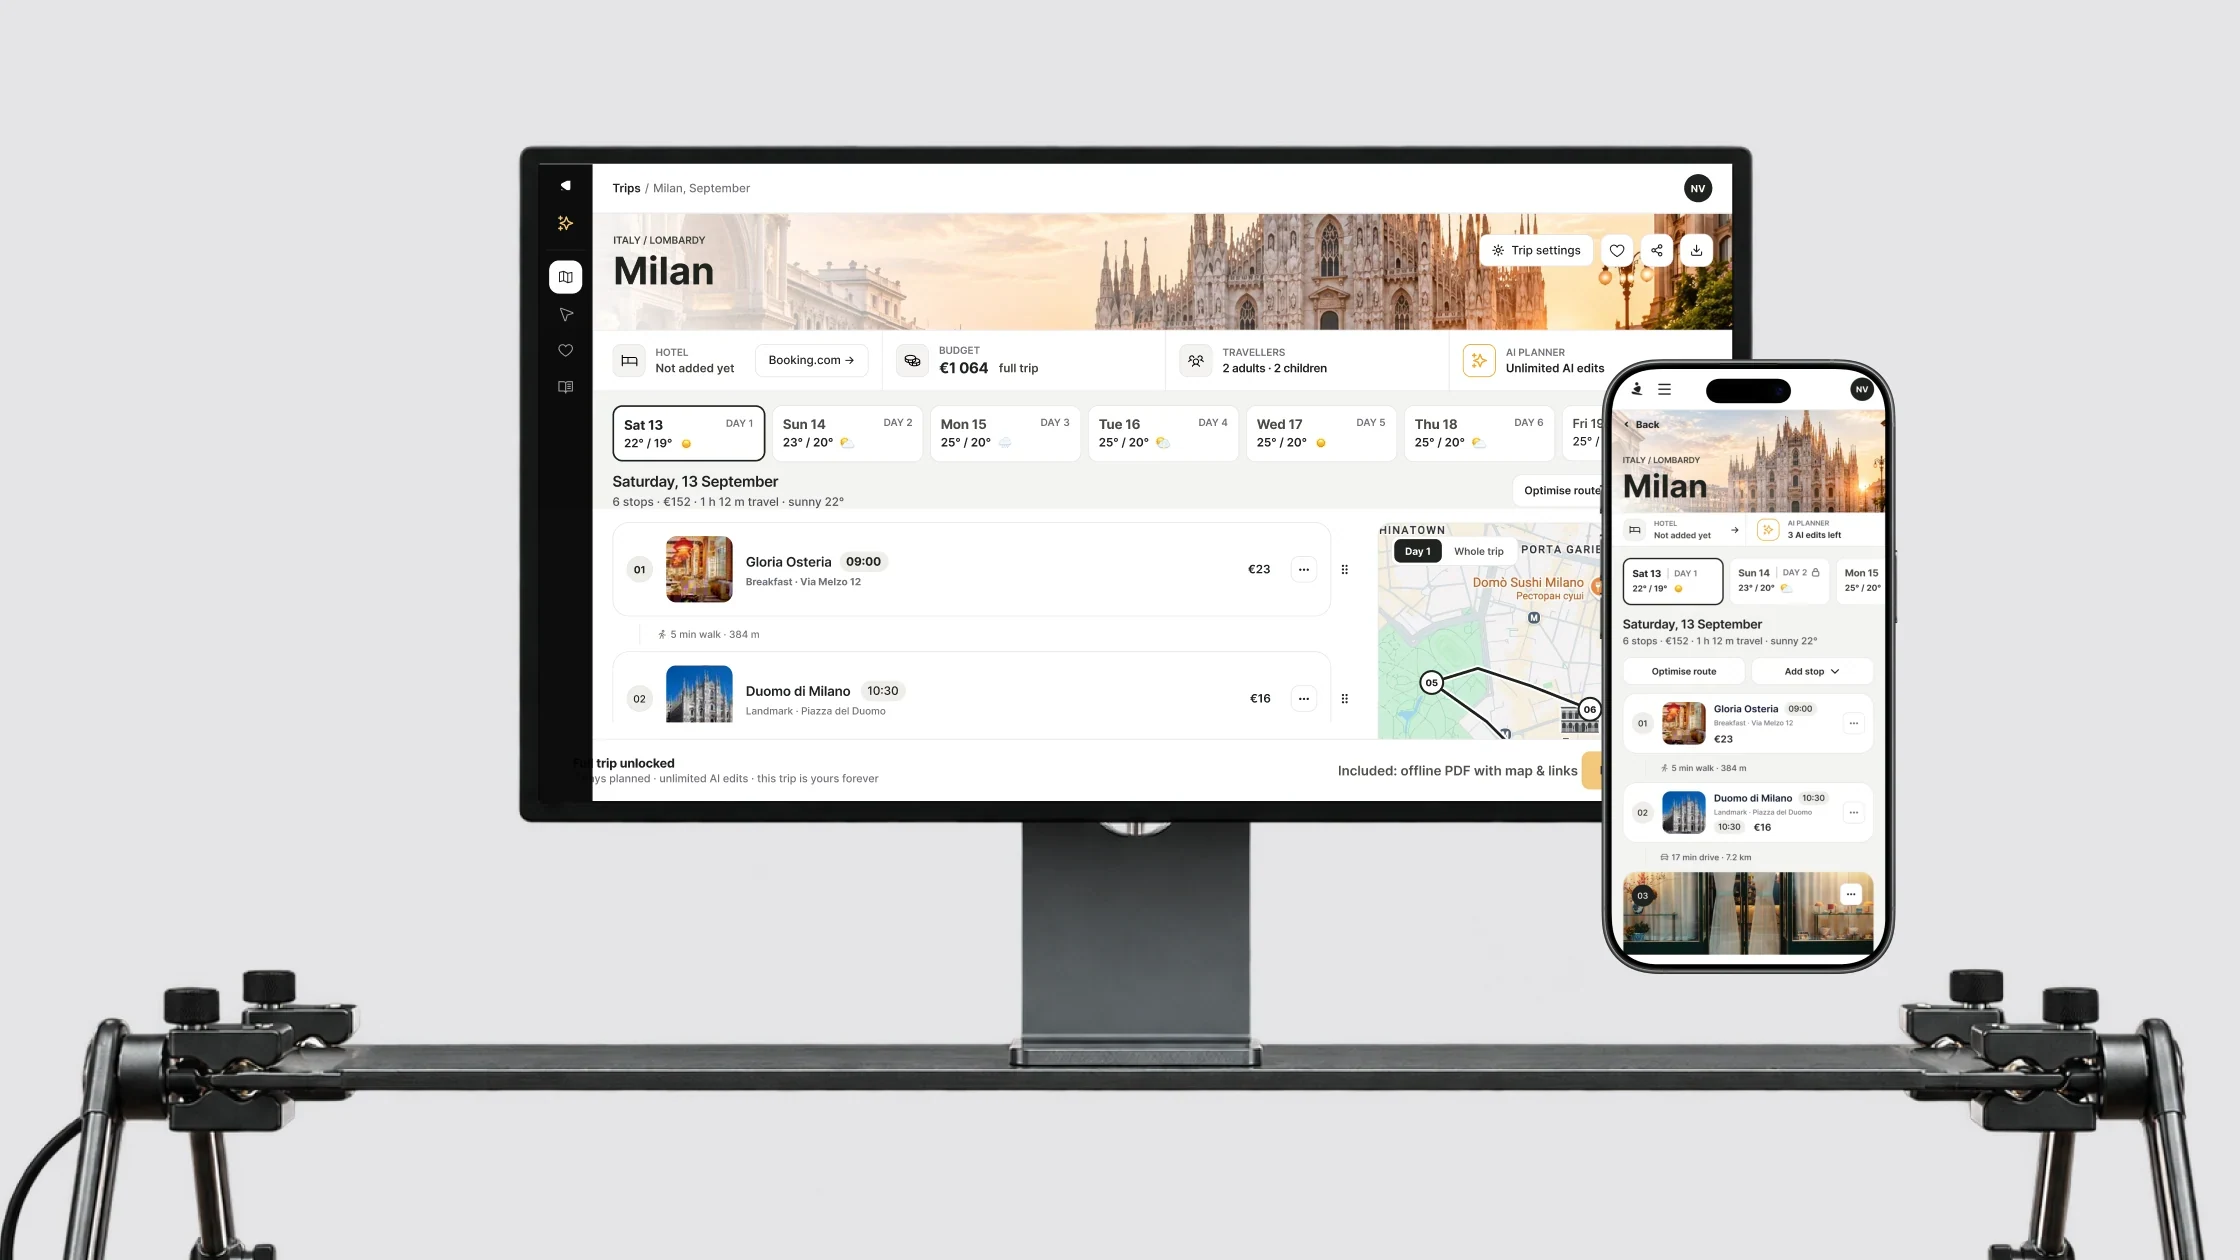
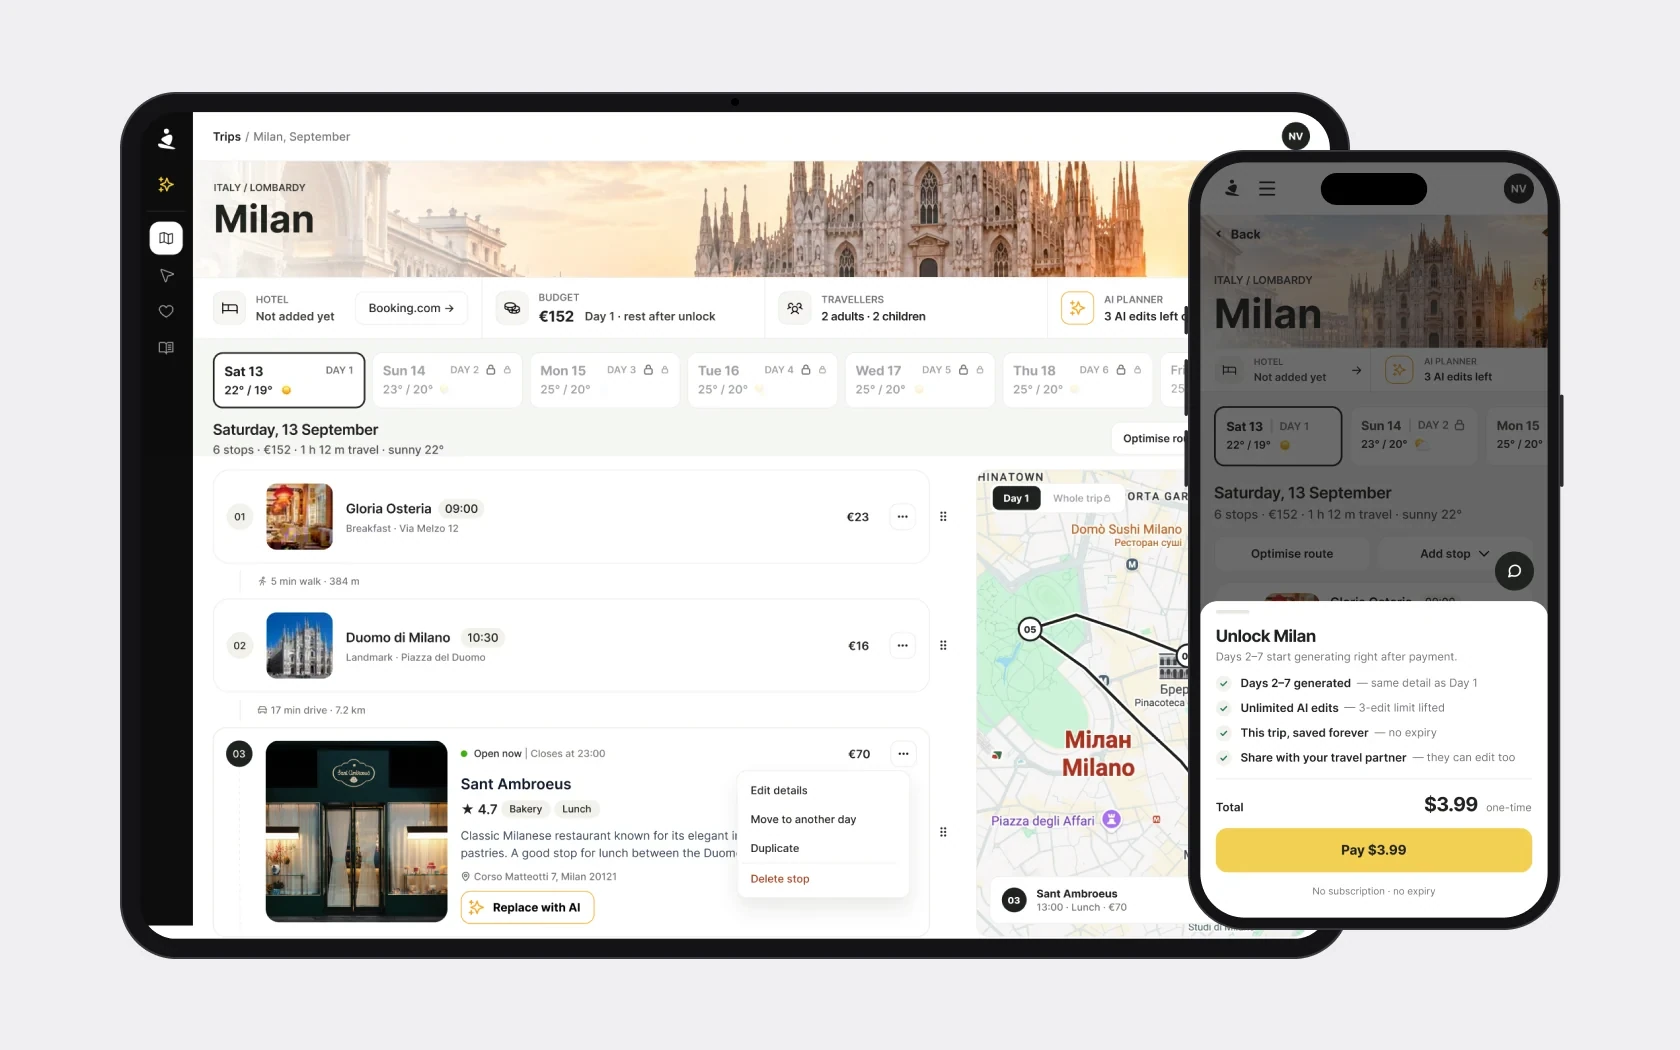
- Days behaved differently: the first open, the second a blurred teaser, the rest locked. Repeated blocks made a long trip hard to scan, and the map didn’t show all stops.
- What I researched
- I compared competitors across 15 areas and looked at patterns from Airtable, Notion and Linear. The table turned out to be a strong base for editing a route, worth keeping.
- What I suggested
- One table grouped by day, with a link between a row and its marker on the map. Keep dragging stops, route segments and weather, and cut repeated elements.
- What it should change
- People will move between days faster and match the order of stops with the route on the map.
Make the purchase and the state after it clear
- Problem
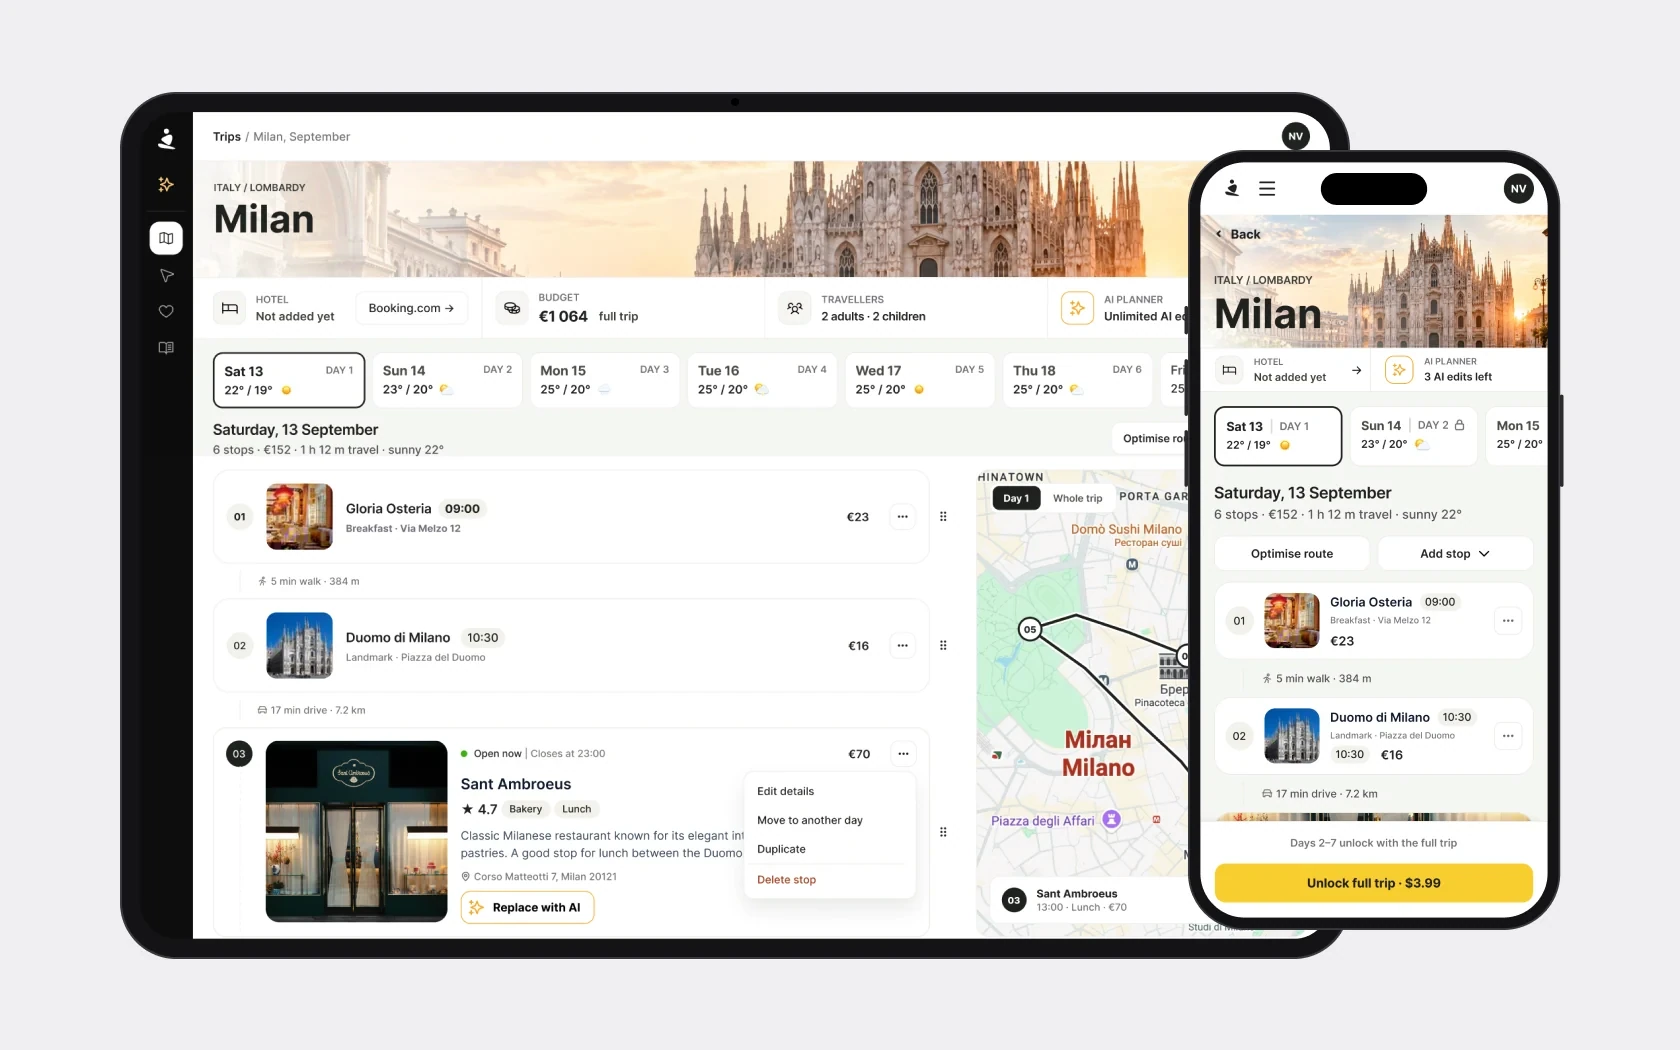
- The interface mixed buying a trip and buying credits. The default offer was a $9.99 pack instead of one trip for $3.99. After unlocking, the credit counter could update only after a reload, and generation of the remaining days wasn’t explained enough.
- What I suggested
- Explain a single purchase through the trip, and a pack through credits. Align names and the description of access, show generation and update the credit balance on time. I prepared a matrix of 11 states so the page’s behaviour could be agreed before detailing the mockups.
- What it should change
- People will see what they buy, whether payment went through and when the full plan will be ready.
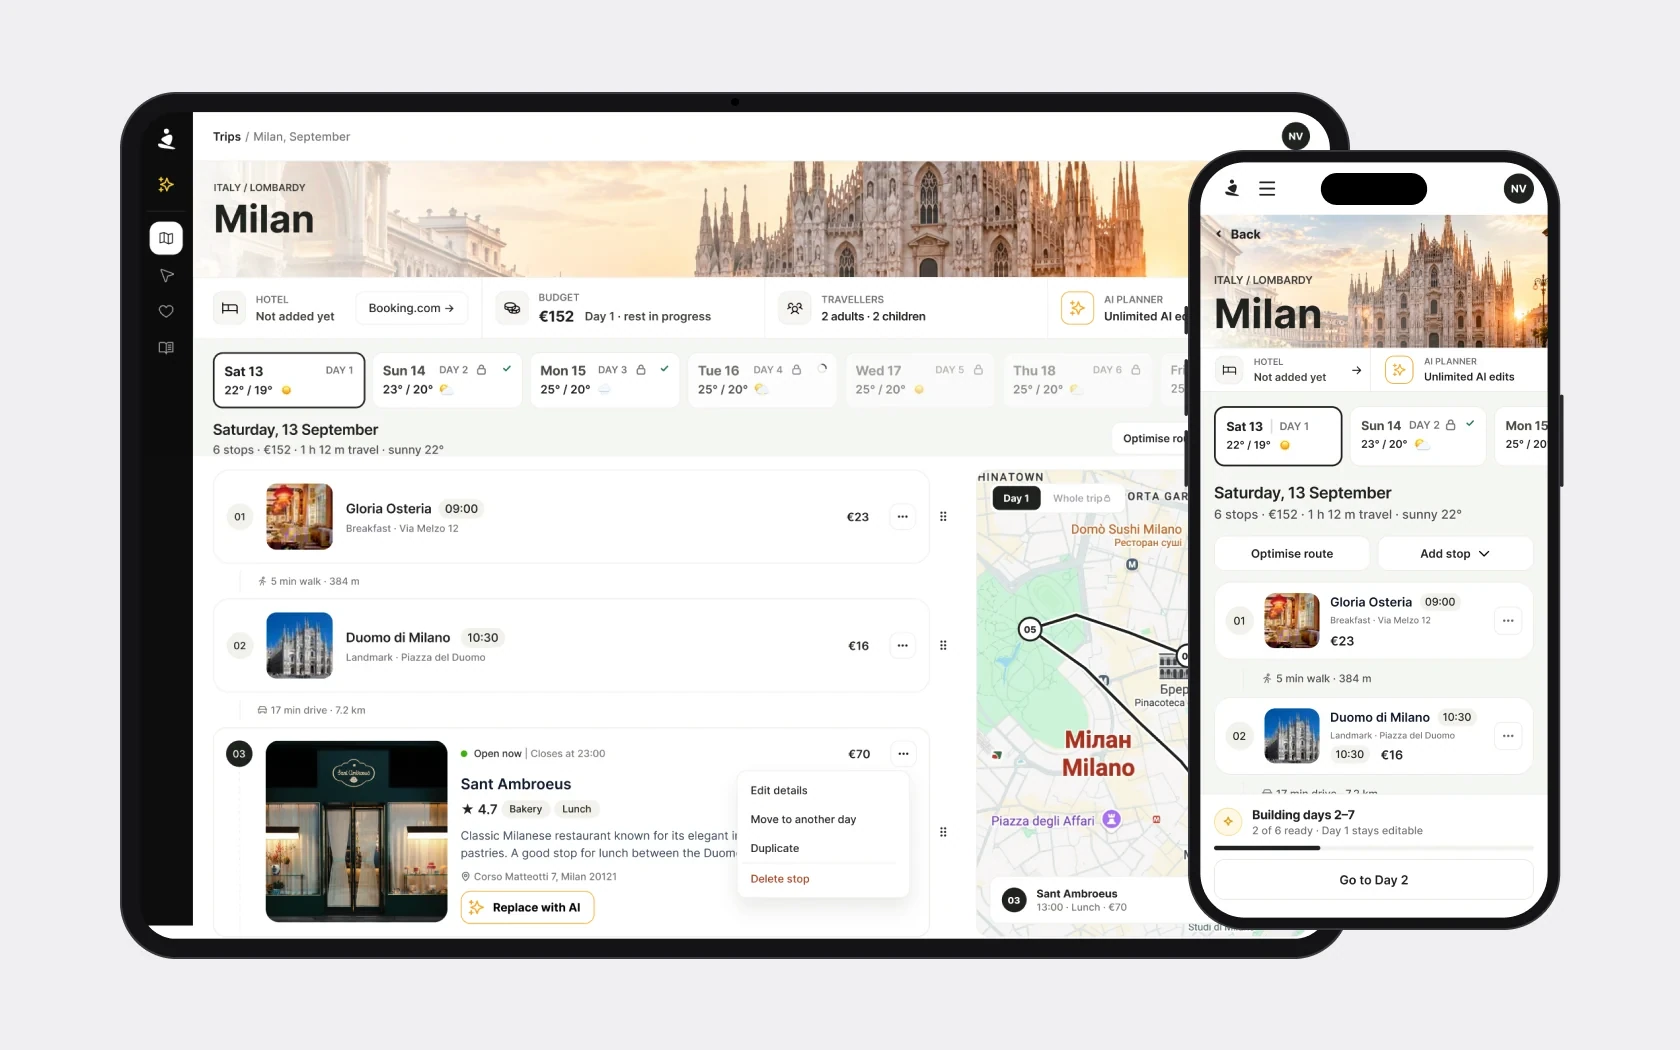
Prototype
From a ready trip to a new one
It starts on a ready trip to Paris; from there ✦ opens a side panel to create a trip to Milan. The creation screens are drawn to match the redesign; the Plan Page is from the redesign. The prototype plays on its own; switch to «Try it yourself» to click through it.
- Paris · a ready trip
- Where to
- Dates
- Create the trip
- Day 1 is generating
- Day 1 for free
- Payment
- Days 2–7 are generating
- The full trip
How I set the redesign scope
Within the agreed 12–15 hours, priority went to changes in explanations, order of elements and visibility of actions:
- the partial budget and its update;
- unlock terms;
- states after payment;
- navigation between days;
- clear editing actions.
AI with change comparison and undo, recommendations for free time slots and comments on stops I left for later iterations.
How to check the changes
Before implementation, the events need to be agreed and baseline figures recorded. To evaluate the redesign I suggested tracking:
| What we check | What we measure |
|---|---|
| Clarity of the offer | Plan view → offer opened → successful purchase |
| Ease of working with the route | First edit, moves between days, map interactions |
| AI usage | Run → result → accept or undo |
| State after payment | Generation finished and the budget updated correctly |
Separately, when testing the scenarios, it’s worth finding out whether people understand what the budget includes and what exactly opens after purchase.
Result and takeaways
Discovery turned the general request “simplify the Plan Page” into a concrete redesign plan:
- 30 problems with evidence and recommendations;
- a proposed structure with 7 element moves;
- a matrix of 11 interface states;
- 7 items for development;
- priorities for extending tracking.
The most important thing for me was matching the numbers with what actually happens in the product. The low AI usage figure turned out to be unreliable because of tracking, and the budget gap was a consequence of generation after payment. These checks changed both how the problems were framed and the proposed solutions.
In my next project I’d check event coverage and the product’s change history at the very start of the analysis – before interpreting percentages.
Next stage: agree the purchase model and scope of changes, finish the mockups and test the key scenarios. The redesign’s effect on conversion and plan usage can be measured after implementation.